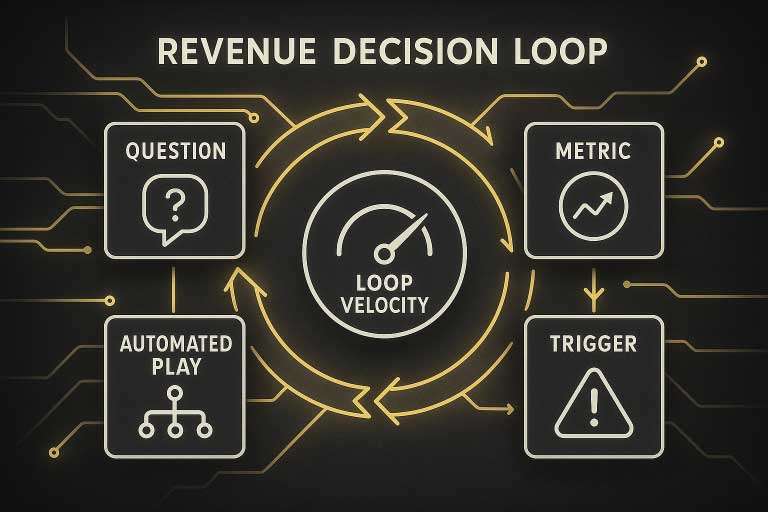
Dashboards describe the past; loops change the future. In this sequel we wire your new RevOps backbone into an always-on feedback circuit—executive questions become metrics, metrics trigger AI-assisted plays, and every play returns fresh signals to the model. The result: finance, sales, and marketing adjust course while the quarter is still in flight.
Reporting vs Feedback
Many leadership teams assume that more charts equal faster decisions. The opposite is true. When insight and action live in different tools, the gap between them—called decision latency—expands. A 2024 Gartner-cited survey found 60 % of data leaders ranked “reducing time to action” as their top analytics priority, yet only 18 % could act on a new KPI within one hour.
Why does latency hurt? IBM research shows that each hour of delay in high-velocity markets compounds risk and erodes margin—especially when competitors automate pricing, routing, or budget allocation in real time. The point: insight that sits equals value that evaporates.
Mapping Questions to Decision Flows
To close the gap we translate leadership questions into self-reinforcing circuits. Think of each circuit as four programmable steps:
Question → Metric → Trigger → Automated Play
The framework is simple enough for board decks yet powerful enough to drive machine learning. Below is a fully worked example for late-stage deal risk.
- Question – “Which in-quarter opportunities are most likely to slip?”
- Metric – AI-derived Deal Health Score blending activity, sentiment, decision-maker coverage, and product usage.
- Trigger – Health < 60 % and opportunity stage unchanged for 14 days.
- Automated Play – The system drafts a rescue email, books an exec-sponsor call in the AE’s calendar, and attaches a relevant customer-story deck—no human coordination required.
We borrow the term “decision flow” from Gartner’s 2025 Data-&-Analytics trend on decision intelligence, which insists that analytics only create value when tightly coupled to frontline action.

AI Revenue-Acceleration Use Cases
Framework in place, let’s see how it works day-to-day. Each scenario below begins with context, then shows how AI closes the loop.
1 · Deal-Cycle Risk Alerts
Any CRO can rattle off deals “at risk,” but gut feel misses nuance. Clari ingests call sentiment, email cadence, legal red-lines, and product telemetry, updating win probabilities continuously; SentinelOne achieved 98 % forecast accuracy by week two of the quarter. When an opportunity back-slides, Clari auto-notifies the AE with a recommended next step and links to enablement content.
2 · Dynamic Budget Reallocation
Marketers once waited weeks for channel ROAS; now tools like Improvado listen to real-time cost-and-revenue streams. If a campaign’s cost-per-opportunity drifts 20 % above threshold, the platform pauses spend and shifts budget to higher-yield audiences—no spreadsheet “traffic-controller”.
3 · Continuous Forecast Refresh
Board forecasts freeze risk into a single number; continuous forecasting turns it into a range that tightens every hour. Clari compares live pipeline changes against historic patterns and alerts finance if the current path trends above or below plan, letting the CFO pull forward cost cuts or marketing bets in-quarter.
4 · Customer-Health Loop-Back
Retention is revenue 2.0. Gainsight streams product-usage “vitals” into a health score that triggers CS or upsell plays the moment behaviour changes, rather than at QBR time. Those signals flow back into marketing audiences so net-new acquisition chases ideal profiles proven by usage, not assumptions.
Closed-Loop Attribution Without Manual Stitching
Attribution isn’t closed-loop until pipeline data flows back to ad platforms in near real time. Modern tools such as Dreamdata and Improvado’s 2025 B2B attribution module push opportunity and revenue milestones directly into Google Ads or LinkedIn, letting algorithms optimise bids on the audiences that actually convert.
Finance also benefits: GL (general-ledger) entries confirm cash, which then reconcile back to CRM objects, adding an immutable source-of-truth layer that ends channel credit disputes.
Measuring Loop Velocity
Operational excellence demands a speedometer. The table below defines three latency KPIs. Hit these and you’re outperforming 80 % of RevOps peers, according to the Gartner-cited Rollstack study.
| Metric | Target | Why It Matters |
|---|---|---|
| Data Freshness | < 5 minutes | Ensures AI models train on live signals, not yesterday’s history. |
| Decision Latency | < 60 minutes | Time between metric breach and play execution—shrinks slippage risk. |
| Action Adoption | > 80 % | Measures cultural (human) uptake, not just technical success. |
Change-Management Playbook
Technology alone can’t enforce new behaviour. The practices below transform loops from pilot curiosities into company habit.
Cross-Functional Data Council. Governance moves from IT to a council chaired by finance, sales, marketing, and CS. McKinsey’s 2024 roadmap to an AI-driven enterprise notes that cross-functional councils are twice as likely to unlock revenue growth than siloed data teams.
Enablement Cadence. Weekly ten-minute video demos show frontline teams exactly how AI triggers save them clicks.
Incentive Alignment. Compensation multipliers reward play adoption (e.g., executing recommended renewal-save steps), not just closed ARR.
Ninety-Day Roadmap
Loops do not require 18-month programmes. The phased schedule below balances “quick wins” with structural foundations.
Weeks 1–3 – Audit & Classify. List every exec question, map to existing metrics, and grade latency. Typical output: 40 questions, four “needle-movers.”
Weeks 4–6 – MVP Loop. Build one end-to-end circuit (e.g., late-stage deal risk). Instrument triggers, automated play, and feedback capture.
Weeks 7–10 – Attribution Feedback. Push won/lost data back to ad algorithms; shrink wasted spend mid-quarter.
Weeks 11–13 – Loop Velocity Dash. Surface freshness, decision latency, and adoption metrics next to pipeline KPIs; execs now see process health and revenue health in one view.
Key Moves to Accelerate Revenue
The closing principles below keep loops humming long after launch.
- Shorten Loop, Sharpen Forecast. Standish-Group research shows projects with sub-hour decision latency succeed 3× more often.:contentReference[oaicite:10]{index=10}
- Automate Explanations, Not Just Actions. Reps trust rescue plays when the AI also explains why the deal is at risk.
- Close with Cash. Finance validation is the final node; without it, the loop never truly closes and marketing spends argue attribution forever.
Conclusion
The hard work you did in Part 1 laid tracks; today you’re running high-speed trains. With architecture and feedback circuits united, RevOps graduates from data-janitor to revenue air-traffic control. CFOs trade debate for action, marketers reallocate spend mid-flight, and sales forecasts converge on reality. The dashboard era is over; the closed-loop era has begun.

